In the previous post, we created a binary classifier for detecting phishing URLs. Here, we're going to continue exploring the data with visualization techniques.
The Principal Component Analysis (PCA) algorithm carries out a linear mapping of data into a space of lower dimension so that the dispersion of data in a small representation is maximized.
In our case, after reducing the dimension to two components, we have the following outcomes:


After min-max feature normalization, we'll obtain the following picture.


In the next post, we'll try to apply the cluster analysis to this problem.
If you want to play with the model, the source code is available on Github.
To be continued...
Since the number of features or attributes in a model is often more than 2 or 3 (in real models thousands and even millions), the question arises: how to represent objects or observations in two- or three-dimensional space in order to see the patterns of their data distribution to assess the possibility of further classification or clustering as well as verify the correctness of features extraction. For these purposes, you can use the methods of reducing the dimension. Now, we will consider two techniques - linear (PCA) and non-linear (t-SNE) dimensionality reduction.
The Principal Component Analysis (PCA) algorithm carries out a linear mapping of data into a space of lower dimension so that the dispersion of data in a small representation is maximized.
In our case, after reducing the dimension to two components, we have the following outcomes:
- Component 1: −0.998 x Registrar_code + 0.065 x Lifetime + −0.022 x Country_code + 0.006 x Protocol_code
- Component 2: 0.020 x Registrar_code + −0.035 x Lifetime + −0.999 x Country_code + −0.005 x Protocol_code
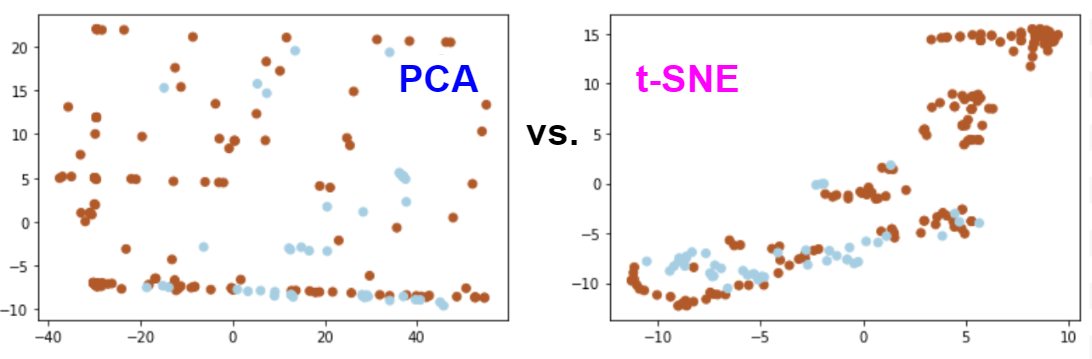
Figure 1. Visualization of URLs in the two-dimensional space after applying the PCA technique (phishing links - orange dots, benign links - blue dots).
It is difficult to identify separate groups of benign and phishing links in Figure 1.
Let us do an experiment and scale Lifetime by multiplying its values, let's say, using the coefficient K=100, then we'll see a major impact from this attribute in one of the PCA components and, as a result, another dots distribution on the plot.
Let us do an experiment and scale Lifetime by multiplying its values, let's say, using the coefficient K=100, then we'll see a major impact from this attribute in one of the PCA components and, as a result, another dots distribution on the plot.
- Component 1: -0.013 x Registrar_code + 1.000 x Lifetime_new + 0.000 x Country_code + 0.000 x Protocol_code
- Component 2: -1.000 x Registrar_code + -0.013 x Lifetime + -0.026 x Country_code + 0.003 x Protocol_code
Figure 2. Visualization of URLs in the two-dimensional space after applying the PCA technique with Lifetime_new := Lifetime * 100 (phishing links - orange dots, benign links - blue dots).
In practice, when we have features of different scale it is recommended to perform feature normalization so they have a similar scale. In a simple case, we can divide a feature value by the max value or range, but more popular techniques are min-max and mean normalizations (see Feature scaling for more methods).
After min-max feature normalization, we'll obtain the following picture.
- Component 1: -0.348 x Registrar_code + 0.271 x Lifetime + 0.069 x Country_code + 0.895 x Protocol_code
- Component 2: -0.258 x Registrar_code + 0.020 x Lifetime + -0.965 x Country_code + -0.032 x Protocol_code
Figure 3. Visualization of URLs in the two-dimensional space after applying the PCA technique with min-max feature normalization (phishing links - orange dots, benign links - blue dots).
Let's try another algorithm - T-distributed Stochastic Neighbor Embedding (t-SNE), which is a non-linear technique for reducing the dimension of data with and without feature scaling.
Figure 4. Visualization of URLs in the two-dimensional space after applying the t-SNE technique (phishing links - orange dots, benign links - blue dots).

Figure 5. Visualization of URLs in the two-dimensional space after applying the t-SNE technique with min-max feature normalization (phishing links - orange dots, benign links - blue dots).
Figure 5. Visualization of URLs in the two-dimensional space after applying the t-SNE technique with min-max feature normalization (phishing links - orange dots, benign links - blue dots).
In all the cases, we can see that the links tend to be distributed in two classes. Feature scaling helps to make it look more clear. This confirms that there are attributes or their combinations, the values of which can be used for separation of the objects between the classes.
If you want to play with the model, the source code is available on Github.
To be continued...
No comments:
Post a Comment